
PROTECT OUT OCEAN (DATA VISUALIZATION)
Our world is increasingly being scanned, sensed, and logged into datasets by multiple stakeholders. Increasingly, that spatial data is being made available in realtime — allowing communication designers to produce data visualizations that serve as archives of the past, and simultaneously constantly-updated reflections of the present. With realtime data, visualizations no longer are made obsolete upon execution, but can update, reform, and invert as new data flows into the visualization algorithm.
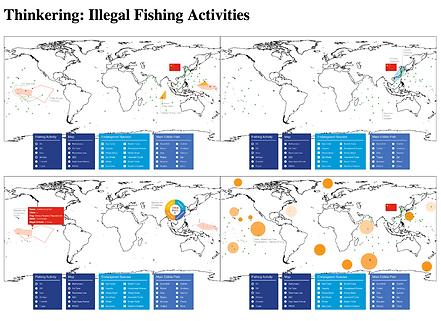
In this project, I focused on ocean fishery activities. The existing datasets online are messy, so I designed this website to help audiences to sort the fishery vessel information by countries. I hope this website can encourage more people to pay attention to the illegal fishing activities and take actions on it.
Key word: data visualization, Hype 3, D3, JavaScript, HTML, CSS, prismic.io, GitHub, Grasshopper, laser cutting, AWS
Viewers need to view the file in Safari, and under “develop" menu,
set “Disable Cross Origin Restrictions” now
2D DATA VISUALIZATION
I get API about vessel activities by countries from open sources, and depends on what kind of data I can get, I sketched and made video to explore how can I present my data. After I decided the forms, I use JS and D3 to code it.

BLOG
To capture my design process, thoughts and experiments related to data visualization, and inspirations form others' work, I created a blog to document all the information.

TUTORIAL
To share my experiences, I created a tutorial to guide people who are interested in my project to duplicate it. I shared all my codes and also point people to related resources.
3D DATA VISUALIZATION
3D data visualization is the new frontier of design. In this project, I also explore how to use Grasshopper with Rhino 3D together to make cool 3D data visualization by the real-time data we collected from the API.

BUILD USING PLAY-DOH

BUILD USING RHINO
TURN DATA INTO PHYSICAL OBJECTS
After I decided what form I will apply to structure my data, I use grasshopper to turn my data (JSON file) into shapes in Rhino. Then I export the shapes into AI file and import it in to a laser cutting machine.
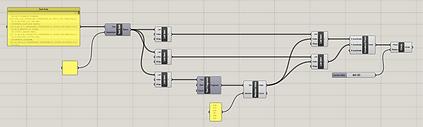

CODE BY GRASSHOPPER

CONVERT INTO AI FILE

LASER CUT
FINAL OBJECTS
The final objects are 3 sets of etch laser cut acrylic boards with 4 in each set. The three sets represent three area vessel activities. One board in each set represents the map, and the other three are vessels from China, German, and USA, which viewers can overlay them on top of the map board to explore the patterns of their vessel activities.
With the data in hand, first I need to decide what kinds of 3D data visualization I want to build. 3D is hard to imagine than 2D, so I explore possible forms with material at hand. In this case, it's play-doh. After I decide what kind of form I may apply, I further explore the structure in Rhino to see.
EXPLORE THE FORMS


