In this project we are working with the University of Chicago to help think about how we might help support patients being treated with external beam radiation therapy.
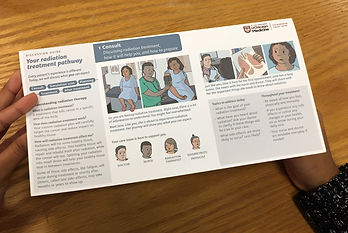
When patients present to the radiation oncology clinic for the first time they often know very little about external beam radiation, the associated treatment process, and what to expect. Our job will be to design a visual narrative that will help physicians and nurses communicate important information about the radiation treatment process to patients.
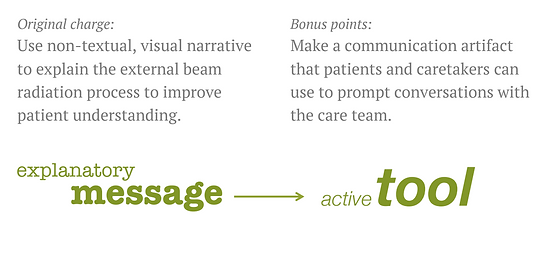
In this project, we want to use non-textual, visual narrative
to explain the external beam radiation process to improve patient understanding and make a communication artifact that patients and caretakers can use to prompt conversations with the care team. As result, we want to decrease the overall level of anxiety patients may have before, during and after the treatment through improved explanation of the process.
Key words: design research, interview, observation, secondary research, coding and analysis, design requirement, system thinking, user testing, engage stakeholders, storytelling, models, sketching, visual narratives, prototyping, patient communication
CEBRE - COMMUNICATION TOOL TO EXPLAIN EXTERNAL BEAM RADIATION TO DECREASE PATIENTS ANXIETY
PROBLEM STATEMENT
CONTENT IS COMPLEX
• Understanding the basics of external beam radiation and its treatment process for cancer is not easy.
• The process is often considered a black box by patients.
• There are multiple phases to the process.
• The details of the process vary by the patient’s conditions.
CURRENT SITUATION
• Text heavy: technical, difficult to understand
• Sparse visuals: requires effort, information not immediate
• Highly generalized info: not personalized to the condition
• Uni-directional medium: doesn’t support interaction/dialog

SOLUTION GOAL
We want to decrease the overall level of anxiety patients may have before, during and after the treatment through improved explanation of the process.
RESEARCH PLANNING

From research to producing the final product, there are only 14 weeks. So as a team we need to adapt a more flexible process and generate new tools to collect and analyze the data more efficiently.
SECONDARY RESEARCH

To maximize the learning from secondary literature, we assigned our team members to different topic areas to explore. The we used what we learned to inform our primary research and prototype design.
PROTOTYPE
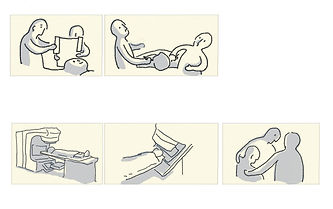
After learning about the external beam radiation process through secondary research, expert presentation and observation in the facility, we came up with three different visual formats and three different colors to explain two same processes. We brought those prototypes into our first round interviews.


PRIMARY RESEARCH
To better understand the experiences and emotions triggered along the process, we interviewed both physicians and patients to learn about their experiences and pinions.
INTERVIEW SUBJECTS
• Radiation oncologists/physicians (2)
• Nurses (2)
• Medical assistant (1)
• Radiation therapists (8)
• Physicist (3)
• Dosimetrist (1)
• Front desk staff/Patient service
representatives/Billing specialist (2)
• Social worker (1)
• Family or other caretakers (5)
• Patients (10)

DATA COLLECTION


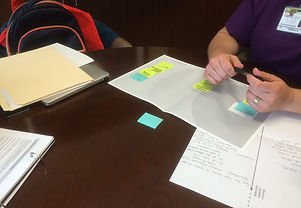
OBSERVATION & IMMERSIVE EXPERIENCES
EXPERT ENGAGEMENT

STAKEHOLDER INTERVIEW

PATIENT JOURNEY ACTIVITY 1

PROTOTYPE TESTING

CARE CIRCLE ACTIVITY

PATIENT JOURNEY ACTIVITY 3
PATIENT JOURNEY ACTIVITY 2
RAPID CODING & ANALYSIS
Coding and analysis is very time consuming, so for this project, we adapt some new methods to shorten this process without losing important insights. We used two methods to analyze our interview: first, we debrief as a small team right after the interview to capture our aha moments. Second, after transcribing the interviews, we extracted insights from the interview again. All the aha moments and insights will be captured and organized in certain framework.

TEAM DEBRIEF FORM (PART)

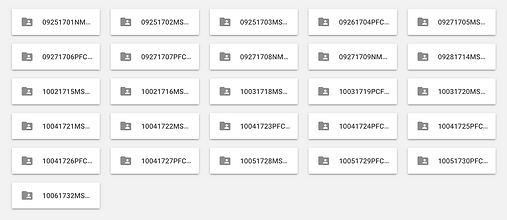
TEAM DEBRIEF RESPONSES SPREADSHEET

INTERVIEW INSIGHTS EXTRACTION SPREADSHEET
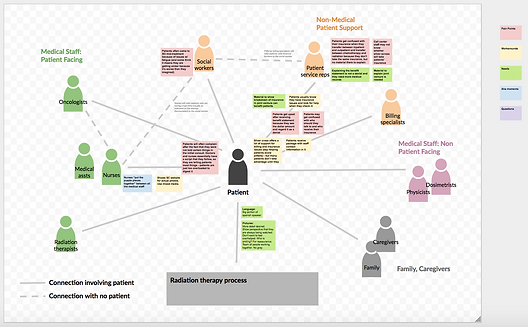
PERCEPTION MAP TO STRUCTURE INSIGHTS
FROM ANALYSIS TO SYNTHESIS
To reduce the time of analysis and synthesis, we tried to do those two steps at the same time. We invited our client to join us and analyze the insights together with us. Then we began to discuss about the content strategies triggered by those insights. We captured what content should be presented and what functions the tool should have. We even sketched some visual narratives along the way.

ANALYSIS

SYNTHESIS
PROTOTYPE

After synthesizing the insights we collected, we begin to explore the design the tool including different ways to draw visual narratives, organize the content and design the format of the tool. After deciding the frames of visual narratives and content we want to put in the tool, we combine them together to see how the images and text can fit each other and serve the conversation between patients and physicians better. We do several rounds of iteration to refine the tool.

FORM FACTORS


SKETCHES (CONSULT)
ORGANIZE SPACES
SKETCHES (SIMULATION)

ITERATION OF PROTOTYPES

FIRST ITERATION (INSIDE)

FIRST ITERATION (OUTSIDE)
FINAL PRODUCT
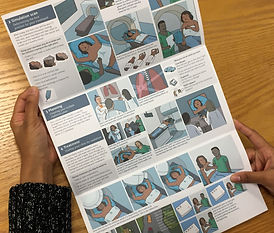
After rounds of iteration between visual styles, contents, and form factors, we come up with a final products for testing in University of Chicago and other sites.


FINAL PRODUCT (INSIDE)
FINAL PRODUCT (OUTSIDE)