
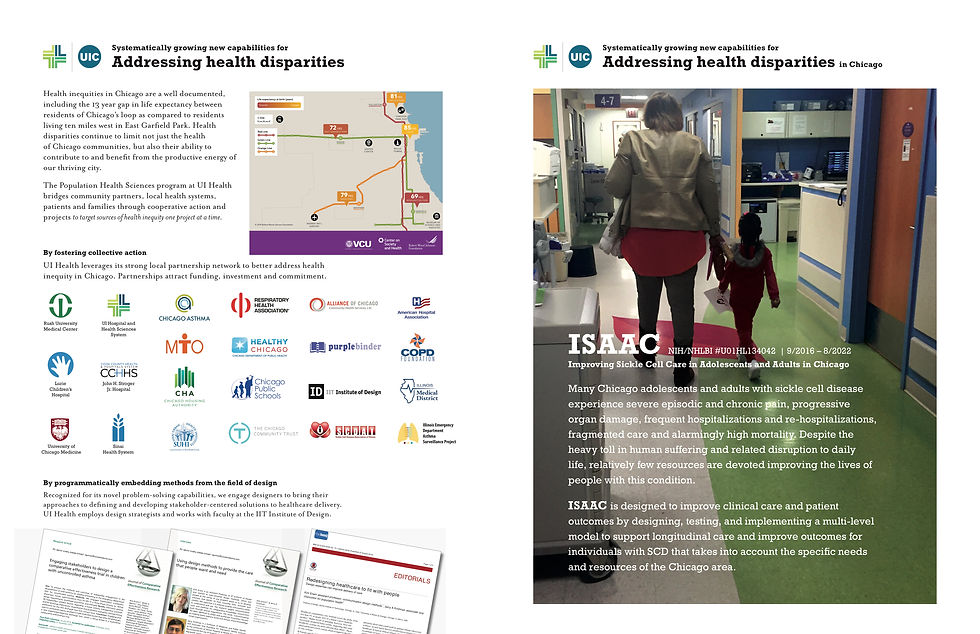
Many Chicago adolescents and adults with sickle cell disease experience severe episodic and chronic pain, progressive organ damage, frequent hospitalizations and re-hospitalizations, fragmented care and alarmingly high mortality. Despite the heavy toll in human suffering and related disruption to daily life, relatively few resources are devoted improving the lives of people with this condition. ISAAC is designed to improve clinical care and patient outcomes by designing, testing, and implementing a multi-level model to support longitudinal care and improve outcomes for individuals with SCD that takes into account the specific needs and resources of the Chicago area.
I worked in the team for six months, and we did an intensive tool analysis, literature review, primary data collection through observation and interview, data analysis, prototype, and also built a working space to engage stakeholders. Trying to improve care quality for complex patients in a complex system is challenging, and we created new design methods to tackle those problems in healthcare where existing design methods may be insufficient.
Key words: design research, interview, grounded theory, lit review, coding and analysis, design requirement, system thinking, user testing, tool analysis, engage stakeholders, storytelling, models
ISSAC - IMPROVING SICKLE CELL CARE IN ADOLESCENTS AND ADULTS IN CHICAGO
PROJECT INTRODUCTION
RESEARCH PLANNING
NEED ASSESSMENT
Before we start the research, we need to figure out what research objectives we want to achieve and what research questions we want to ask. Also we need to decide stakeholders we want to involve, what kind of information we want to acquire for them, how many of each type of stakeholders we want to recruit and how to recruit them.

HUMAN SUBJECTS TABLE

RESEARCH TIMELINE
After decide who we want to talk to, we need to make a plan for the project to make sure we can deliver phase results on time and engage stakeholders at the right time. Because of the scope of the project and time limitation, we need to conduct certain tasks at the same time. So knowing sequences and relationships of different tasks can be critical to optimize the process. We also need to be flexible because recruiting process may not proceed as expected, so we should prepare for the possibility that there are no interviews coming in timely.
SECONDARY RESEARCH
LITERATURE REVIEW
We did two rounds of intensive literature review (though we review secondary resources continuously) in the research process. The first round is before we went to the field which is more general, and the second round is after we already collected and analyzed some data which is more specific to our research questions. We did what do we know about each stakeholders, existing interventions, and also key words analysis.

FIRST ROUND OF LIT REVIEW

SECOND ROUNF OF LIT REVIEW
KEYWORDS VISUAL
After counting the frequency of keywords across multiple papers, we use Tableau to visualize the data by treemap and bubble chart. The keywords we selected are things we are interested in investigating and we are curious about the how may existing studies talk about those topics.
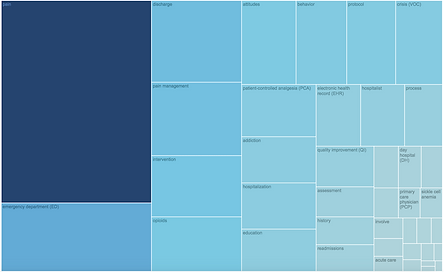
TREEMAP OF KEYWORDS

BUBBLE CHART OF KEYWORDS
SECONDARY RESEARCH BOARDS
We built two secondary research boards, one is for ED/hospitals, and the other one is for adolescence. The boards are not only for engaging stakeholders, but also serving as a reference for us. The boards include keywords analysis, existing intervention, and key facts which are clustered into different categories.

TOOL ANALYSIS
ANALYSIS PROCESS
To better understand the existing practice about sickle cell disease, we collected more than 100 tools from credible resources. After reviewing all the tools, we ruled out some which we don't consider as tools. After all 45 tools related to acute pain were analyzed by usability, accessibility, and actionability. After analyzed the 45 tools, we selected 26 patient/caregiver facing tools to do a in-depth content analysis to learn the content of all those tools. Finally we came up with a model to summarize our findings.


TOOL ANALYSIS SPREADSHEET
CONTENT INDEX SPREADSHEET
MODEL FROM RESEARCH
After analyzing the 26 patient/caregivers facing tools, we generated a model to summarize out finds and also serve as design principles for creating tools for patient and caregivers. There are three stages and 13 principles a good tool should follow. There are more examples in the final slides.

FINAL REPORT OF TOOL ANALYSIS


PRIMATY RESEARCH
SYSTEM THINKING
Healthcare system is a complex system which involves multiple stakeholders. Each stakeholder group has its own needs and concerns. Because power is distributed across the healthcare system, so everyone's opinions should be took care seriously. Designing for sickle cell patients is also designing for the whole system, because any minor broken chains can paralyze the implementation of the design solution. So we must find common grounds of all the stakeholders and take everyone in the system on board.

STAKEHOLDER MAP

INTERVIEW TRAKER

PATIENTS RECRUTING
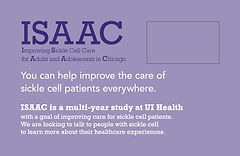
We tried to use Sickle Cell Story Line (patients call us or fill a online survey through the info we provided on posters and flyers) to get in touch with patients at first, but it turned out to be a failure. Then we learned the best way to recruit patients is get them involved face to face when are in the hospital. So we designed the second version of flyers to hand out to patients both in ED and sickle cell clinic.
SECOND ATTEMPT


FIRST ATTEMPT
METHODS AND TOOLS
To collected data from different stakeholders, we applied different data collection methods. We created protocols for different stakeholders and also field notes for observations (see below). We used projectives and drawing activities to facilitate our interview, and used pathway model to capture observation data.

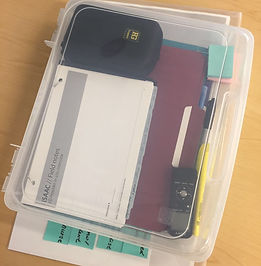

FIELD TOOLKIT
DATA MANAGEMENT (PHYSICAL)
DATA MANAGEMENT (DIGITAL)


PROTOCOL FOR INTERVIEW


PROTOCOL FOR OBSERVATION


PATHWAY MODELS

INTERVIEW & OBSERVATION


PROJECTIVES

DRAWING ACTIVITY
STORY OF SICKLE CELL CARE


After collecting data, we conducted a share out section with our stakeholders. We shared some interesting or shocking stories we heard from our interview, and also explained how design can contribute to healthcare.
CODING AND ANALYSIS
We used two different methods (models for analysis and grounded theory) to help us analyze our data.
MODELS FOR ANALYSIS
The idea of using data to analyze is based on the fact that researchers who conduct the data collection are already aware of what maybe important and interesting to capture in the data analysis process. So "models can act as lenses for processing research data. They can function as tools for non-linear analysis, meaning they allow a team to filter data through a series of specific models, each targeting a particular kind of understanding. And they would produce a series of outputs that are of known value in the planning process" (Kim Erwin). In this project, we tried this method first. We used conception model and BJ Fogg's persuasive technology model to help use analyze the data. After analyzing the data, we created a model to summarize our insights.

SPREADSHEET FOR CODING

MODEL FROM ANALYSIS

GROUP DATA

SKETCH POSSIBLE MODELS

DRAFT OF MODELS
GROUNDED THEORY
We used grounded theory to make sure that our analysis process is grounded to our data. We did individual coding at first and then we did debrief and generated higher level codes. Then we used the high level codes to guide us code new data. The higher level codes are always modified when new data comes in.

HIGHER LEVEL CODES SHEET

FIRST ROUND OF CODING
After coding all the transcript individually, we gathered as a team to consolidate all the grounded level codes to build a master coding spread sheet to help us code all the data under the same structure. Finally we agreed on 307 grounded codes under 37 categories (see below). We coded all the transcripts again to validate the coding system, and we will modify it more when new data comes in.

DECIDE FINAL CODES AND CATEGORIES

FINAL MASTER INDEX

FINAL MASTER CODING SPREADSHEET

SERVICE BLUEPRINT
SYNTHESIS & PROTOTYPE
DESIGN CRITERIA
We used multi level design requirement framework to structure our insights and design criteria. We clustered needs of different stakeholders into content level, users needs level, and contextual level. The user needs we generated can be applied into our solution directly, which fill the gap between research and design solution.

MULTI LEVEL DESIGN REQUIREMENT FRAMEWORK


COLLECT NEEDS
CLUSTER NEEDS

USER TESTING
We tested existing ideas from our stakeholders and partners before developing our own prototype to see potential alternative solutions.
PAPER PROTOTYPE

APP REVIEW

The prototyping process is evolving together with data collection. We adapted the idea of pain passport from one our PR and modified it according to the users needs we found through the research process. The prototyping process is still in process and still may vary a lot following the data collection progress.
PROTOTYPING
CROSS SECTION MODEL


